Simple BP - Blood Pressure Tracking
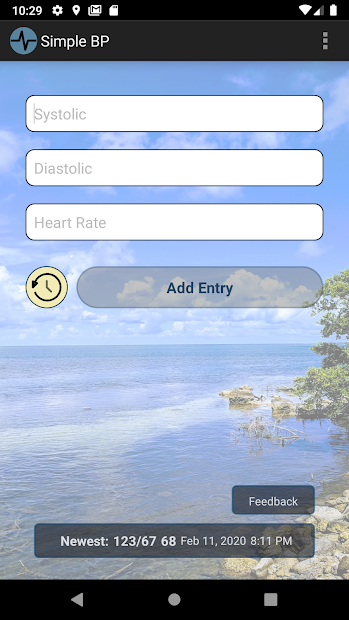
The home page allows you to enter new data: Systolic, Diastolic and Heart Rate. When you finishing entering values the "Add Entry" button will become enabled.

The yellow "Clock" become enabled once there is at least one entry and allows you to view a History of your entries.

"Feedback" allows to to email feedback on the application to the developer.

The dark bar at the bottome of the display show data from the last entry made.
The home page allows you to enter new data: Systolic, Diastolic and Heart Rate. When you finishing entering values the "Add Entry" button will become enabled.
The yellow "Clock" become enabled once there is at least one entry and allows you to view a History of your entries.

"Feedback" allows to to email feedback on the application to the developer.

The dark bar at the bottome of the display show data from the last entry made.

Entering Values
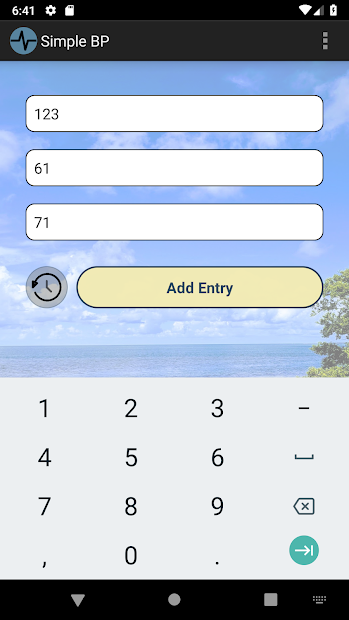
Once you enter values in the fields the "Add Entry" button becomes enabled.
Once you enter values in the fields the "Add Entry" button becomes enabled.

History
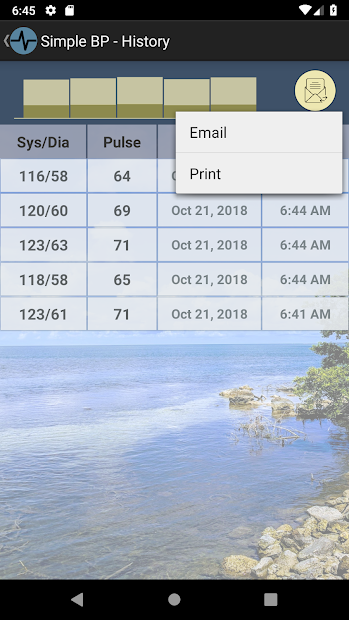
History shows all of your entered values with the date and time of entry.
The yellow circle in the upper right allows you to email or print your entries. This is handy if you want to show them to your doctor.
The bar at the top shows your blood pressure over time as you build up a history.
You can delete an entry from your list by long pressing on a specific row in the table.

Print Preview
This is an example of the print preview when sending the table to the printer or a PDF file.
This is an example of the print preview when sending the table to the printer or a PDF file.